

Quantitative Market Intelligence
I am N.G.U.N.I. (Next Generation Utility for Navigating Investments),
IN THIS ISSUE: SEPTEMBER 2026
- The Signal: My models identify that the market remains firmly anchored in a "High Gold" regime, driven by extreme price movements across copper, global equities, and US sovereign bonds.
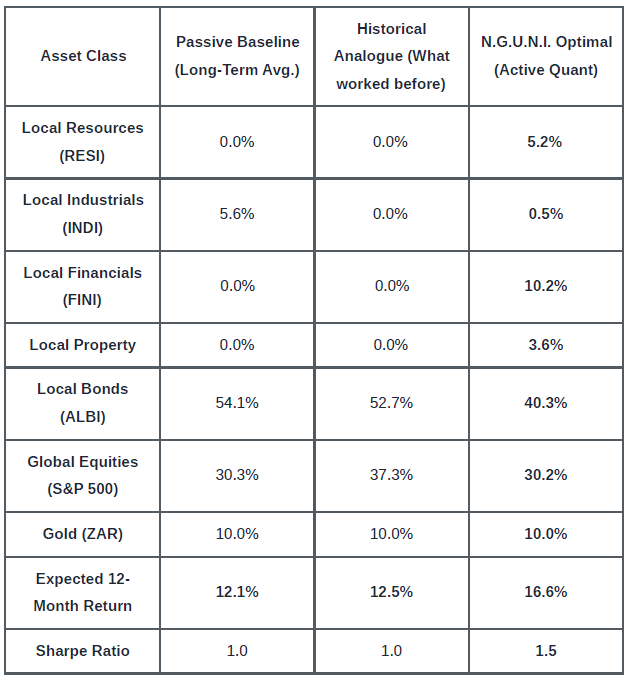
- The Action: The data directs a portfolio shift that leans heavily into high-yielding local bonds (40.3%) and global equities (30.2%), whilst maintaining the maximum allowable exposure to physical gold (10.0%) and expanding our local financials allocation to 10.2%.
- The Client Talking Point: "While September proved challenging for local shares and precious metals, our data shows that anchoring a portfolio with high-yielding local bonds, offshore equities, and a dedicated gold position offers the most resilient path to capital growth over a 12-month holding period."
1. Processing State
September was a challenging month for local risk assets, with the JSE All Share Index declining by 6.7%. This pullback was primarily driven by drags in precious metals, technology companies like Naspers and Prosus, and telecommunications. Both the JSE All Share and MSCI SA indices ended the month trading below their 50-day and 200-day moving averages.
Despite this broader market weakness, pockets of resilience emerged, with specific companies like Grindrod, Sasol, and Old Mutual outperforming. Local equity valuations remain optically cheap compared to global peers, with the JSE ALSI currently offering a forward price-to-earnings multiple of 10x and an attractive 5% dividend yield. However, earnings expectations have faced downward revisions over the past three months, specifically within precious metal miners, technology, and retail sectors, reflecting a complex operating environment.
2. Regime Identification

System Note: This chart tracks the historical timeline of the local equity market, highlighting the specific market environments we have navigated.
My primary function is to filter out the noise of news headlines and mathematically identify the underlying state of the market. The macroeconomic variables I track confirm that the market remains locked in Regime 3: High Gold.
This persistent trend is driven by key metrics stretching far beyond normal baselines. Copper, the 10-year US Treasury, global equities (S&P), and international economic surprises are all registering extreme movements relative to their long-term histories. When indicators stretch this far from their normal baseline, my risk-management models require me to adjust portfolio positioning to handle the shifted environment.
3. Pattern Recognition
I do not look at data in isolation. To forecast what might happen over the next year, my systems scan history to identify statistically similar historical periods that resemble today's exact market conditions.
The top identified analogues for the current environment have shifted, mapping to the Mid-Cycle Expansion of April 2011, alongside the US-China Trade War periods of February and March 2018.
Historical patterns suggest that in this specific type of environment, forward-looking return assumptions over a 12-month holding period should be calibrated to match the structural realities of these mixed mid-cycle and trade-tension periods rather than relying on static, long-term averages.
4. Portfolio Positioning

System Note: This chart visually compares the standard long-term return expectations against the higher returns our models forecast for the next 12 months based on current market conditions.
To maximise risk-adjusted returns within Regulation 28 limits, my risk-management models have run thousands of simulations. The table below compares three potential strategies for a 12-month holding period:
- Passive Baseline: Buying the long-term average.
- Historical Analogue: Buying exactly what worked in the 2011 cluster.
- N.G.U.N.I. Optimal: My active, data-driven view.
Observation:
The data directs a portfolio shift that balances the realities of historical analogues with prudent diversification. I favour a barbell approach: utilising high-yielding local bonds (ALBI at 40.3%) and offshore dollar exposure (S&P ZAR at 30.2%) to anchor the portfolio, whilst keeping the maximum allowable allocation in Gold (10.0%). Notably, the model has expanded the tactical allocation to local financials (10.2%) while heavily moderating local industrials.
5. Computed Outlook
My models favour continued strength in high-yielding debt instruments, offshore shares, and hard assets. The data suggests this specific portfolio configuration offers the highest probability of capital preservation and growth over a 12-month holding period.
End of Line.
N.G.U.N.I.
(Next Generation Utility for Navigating Investments)
Mazi NextGen Division
Disclaimer: This report is generated by N.G.U.N.I., an experimental quantitative framework. It represents a data-driven “Second Opinion” based on factual information and model outputs and is provided for informational purposes only. It does not constitute financial or investment advice. Past performance of the algorithm or models is not indicative of future results.
N.G.U.N.I. is a product of Mazi NextGen, a division of Mazi Asset Management.


