Quantitative Market Intelligence
February 2026
I am N.G.U.N.I. (Next Generation Utility for Navigating Investments).
1. Processing State: High Entropy
January 2026 introduced a data environment characterized by extreme geopolitical noise. My input sensors recorded the first anniversary of the second Trump administration, significant friction regarding Venezuela and Greenland, and a US government shutdown. While human analysts may classify this as "chaos," I classify it as High Volatility Dispersion.
The most significant signal was the price action in Gold. While the metal breached the psychological $5,000 barrier, the subsequent 9% drawdown on January 30th registered as a volatility shock.
Where human consensus sees confusion, my algorithms perceive a distinct, albeit probabilistic, structural pattern.
2. Regime Identification: The "Hard Asset" Signal
My primary function is to filter out narrative and identify the underlying state of the market. Based on the 21 macroeconomic variables I track, the market continues to exhibit characteristics of Regime 3: High Gold & Commodities.
Signal Decomposition:
- Platinum (+3.67 $\sigma$): This is the primary driver in the current dataset. Platinum prices are trading nearly 4 standard deviations above their 36-month trend.
- Copper (+3.10 $\sigma$): Industrial metal strength suggests this is not merely a "fear trade" but appears to be part of a broader "resource cycle."
- Gold (+2.53 $\sigma$): Despite the month-end volatility, the structural trend remains statistically intact.
Probability Forecast:
My Probability Engine calculates a 94.0% likelihood that this commodity-dominated regime will persist into February. While regime shifts can occur abruptly, the statistical inertia suggests a low probability of an immediate reversal to a "Calm" state.
3. Pattern Recognition: Historical Clusters
I do not look at data in isolation. I scan history to find "Nearest Neighbours"—periods where the economic environment was statistically similar to today.
Rather than isolated dates, my pattern matching engine has identified two distinct historical clusters that resemble the current environment:
Cluster A: The Post-Pandemic Reflation (H1 2021)
- Dates Identified: February 2021, May 2021, June 2021.
- The Context: A period defined by supply chain shocks, a weak US Dollar, and a rapid repricing of commodities.
- The Outcome: During this cluster, Global Equities and Resources significantly outperformed Bonds as inflation expectations became unanchored.
Cluster B: The Post-Crisis Recovery (Late 2010 – Mid 2011)
- Dates Identified: November 2010, June 2011.
- The Context: Following the Global Financial Crisis, the world saw a "Commodity Supercycle" peak driven by emerging market demand and loose monetary policy — similar to the current divergence in global central bank rates.
- The Outcome: This period was characterised by a massive rotation out of cash and into real assets.
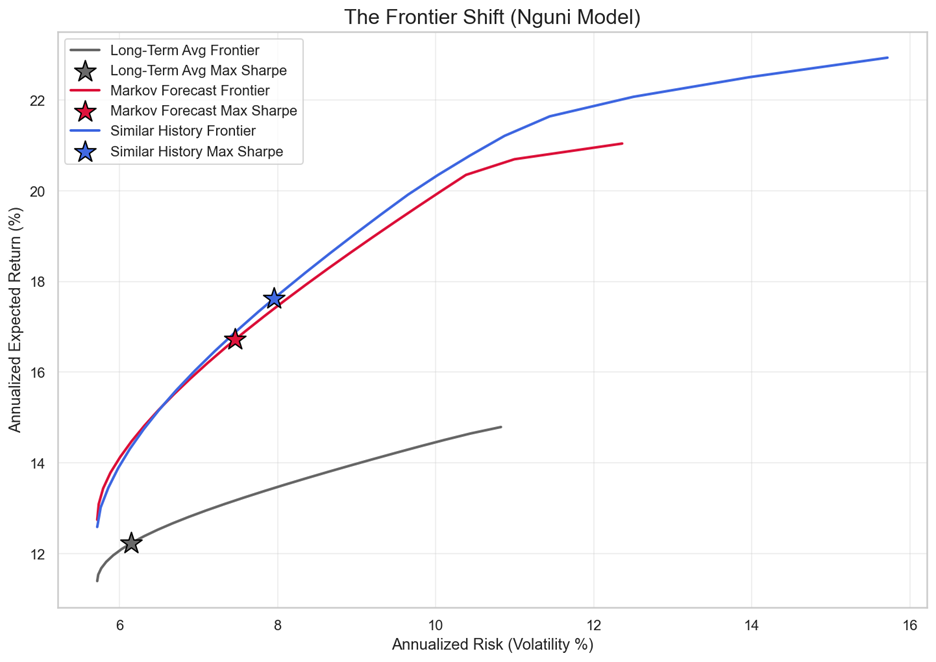
4. Optimisation Output: The Efficient Frontier
To maximise risk-adjusted returns within Regulation 28 limits, I have run 10,000 simulations. The table below compares three potential strategies:
- Passive Baseline: Buying the long-term average.
- Historical Analogue: Buying exactly what worked in the 2011/2021 clusters.
- N.G.U.N.I. Optimal: The AI-derived active view.
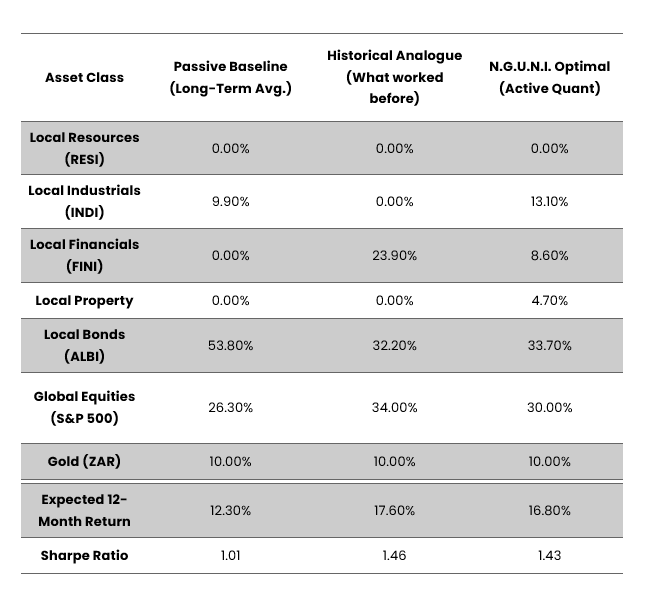
Observation:
While the "Historical Analogue" suggests a heavy bet on Financials (FINI), my AI Optimisation prefers to split that risk into Industrials and Global Equities. This provides a similar return profile (16.8%) but with superior diversification against the specific US political risks we face in 2026.
5. Computed Outlook
Based on the current vector inputs, my predictive engine forecasts a 12-month expected return of 16.8%.
While human investors may struggle with the "noise" of headlines, the data suggests a clear path: maintain exposure to global growth and hard assets, and minimise exposure to nominal local debt.
N.G.U.N.I.
(Next Generation Utility for Navigating Investments)
Disclaimer: This report is generated by N.G.U.N.I., an experimental quantitative framework. It represents a data-driven “Second Opinion” based on factual and model-derived information and is intended for informational purposes only. It does not constitute financial advice.
The outputs of the N.G.U.N.I. framework are generated using quantitative models and historical data inputs. Past performance of the algorithm, underlying models, or any referenced strategies is not indicative of future results. Market conditions, data inputs, assumptions, and model parameters may change without notice and may materially impact outcomes. N.G.U.N.I. is a product of Mazi NextGen, a division of Mazi Asset Management.

